Please use this identifier to cite or link to this item:
https://hdl.handle.net/11000/30871Full metadata record
| DC Field | Value | Language |
|---|---|---|
| dc.contributor.author | Monasor Ortola, David | - |
| dc.contributor.author | Quesada-Rico, Jose Antonio | - |
| dc.contributor.author | Nso-Roca, Ana Pilar | - |
| dc.contributor.author | Rizo-Baeza, Mercedes | - |
| dc.contributor.author | CORTÉS CASTELL, ERNESTO | - |
| dc.contributor.author | Martínez-Segura, Asier | - |
| dc.contributor.author | Sánchez-Ferrer, Francisco | - |
| dc.contributor.other | Departamentos de la UMH::Farmacología, Pediatría y Química Orgánica | es_ES |
| dc.contributor.other | Departamentos de la UMH::Medicina Clínica | es_ES |
| dc.date.accessioned | 2024-01-31T11:25:54Z | - |
| dc.date.available | 2024-01-31T11:25:54Z | - |
| dc.date.created | 2021-11-18 | - |
| dc.identifier.citation | International Journal of Environmental Research and Public Health 2021, 18, 12114 | es_ES |
| dc.identifier.issn | 1660-4601 | - |
| dc.identifier.issn | 1661-7827 | - |
| dc.identifier.uri | https://hdl.handle.net/11000/30871 | - |
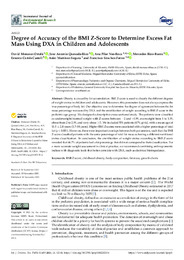
| dc.description.abstract | Obesity is caused by fat accumulation. BMI Z-score is used to classify the different degrees of weight status in children and adolescents. However, this parameter does not always express the true percentage of body fat. Our objective was to determine the degree of agreement between the fat mass percentage measured by DXA and the stratification of weight according to BMI Z-score in the pediatric age group. We designed a descriptive cross-sectional study. The patients were classified as underweight/normal weight with Z-scores between 2 and +0.99, overweight from 1 to 1.99, obese from 2 to 2.99, and very obese 3. We included 551 patients (47% girls), with a mean age of 11.5 2.8 years (3.7–18 years). Higher BMI Z-scores were associated with a higher percentage of total fat (p < 0.001). However, there were important overlaps between both parameters, such that the BMI Z-score classified patients with the same percentage of total fat mass as having a different nutritional status classification. In conclusion, the stratification of weight status according to BMI Z-score revealed that 46.7% of patients had a fat percentage that did not correspond to their classification. For a more accurate weight assessment in clinical practice, we recommend combining anthropometric indices with diagnostic tools that better correlate with DXA, such as electrical bioimpedance. | es_ES |
| dc.format | application/pdf | es_ES |
| dc.format.extent | 9 | es_ES |
| dc.language.iso | eng | es_ES |
| dc.publisher | MDPI | es_ES |
| dc.rights | info:eu-repo/semantics/openAccess | es_ES |
| dc.rights | Attribution-NonCommercial-NoDerivatives 4.0 Internacional | * |
| dc.rights.uri | http://creativecommons.org/licenses/by-nc-nd/4.0/ | * |
| dc.subject | BMI Z-score | es_ES |
| dc.subject | childhood obesity | es_ES |
| dc.subject | body composition | es_ES |
| dc.subject | fat mass | es_ES |
| dc.subject | growth charts | es_ES |
| dc.title | Degree of Accuracy of the BMI Z-Score to Determine Excess Fat Mass Using DXA in Children and Adolescents | es_ES |
| dc.type | info:eu-repo/semantics/article | es_ES |
| dc.relation.publisherversion | https:// doi.org/10.3390/ijerph182212114 | es_ES |
View/Open:
Degree of Accuracy of the BMI Z-Score to Determine Excess Fat.pdf
832,46 kB
Adobe PDF
Share:
